
The Lineage module allows you to graphically explore the relationships between the different assets of Anjana Data Platform and understand the data lifecycle, from their sources to their final destinations. It is accessed from the navigation panel and is only available to users with the LINEAGE_ACCESS permission.
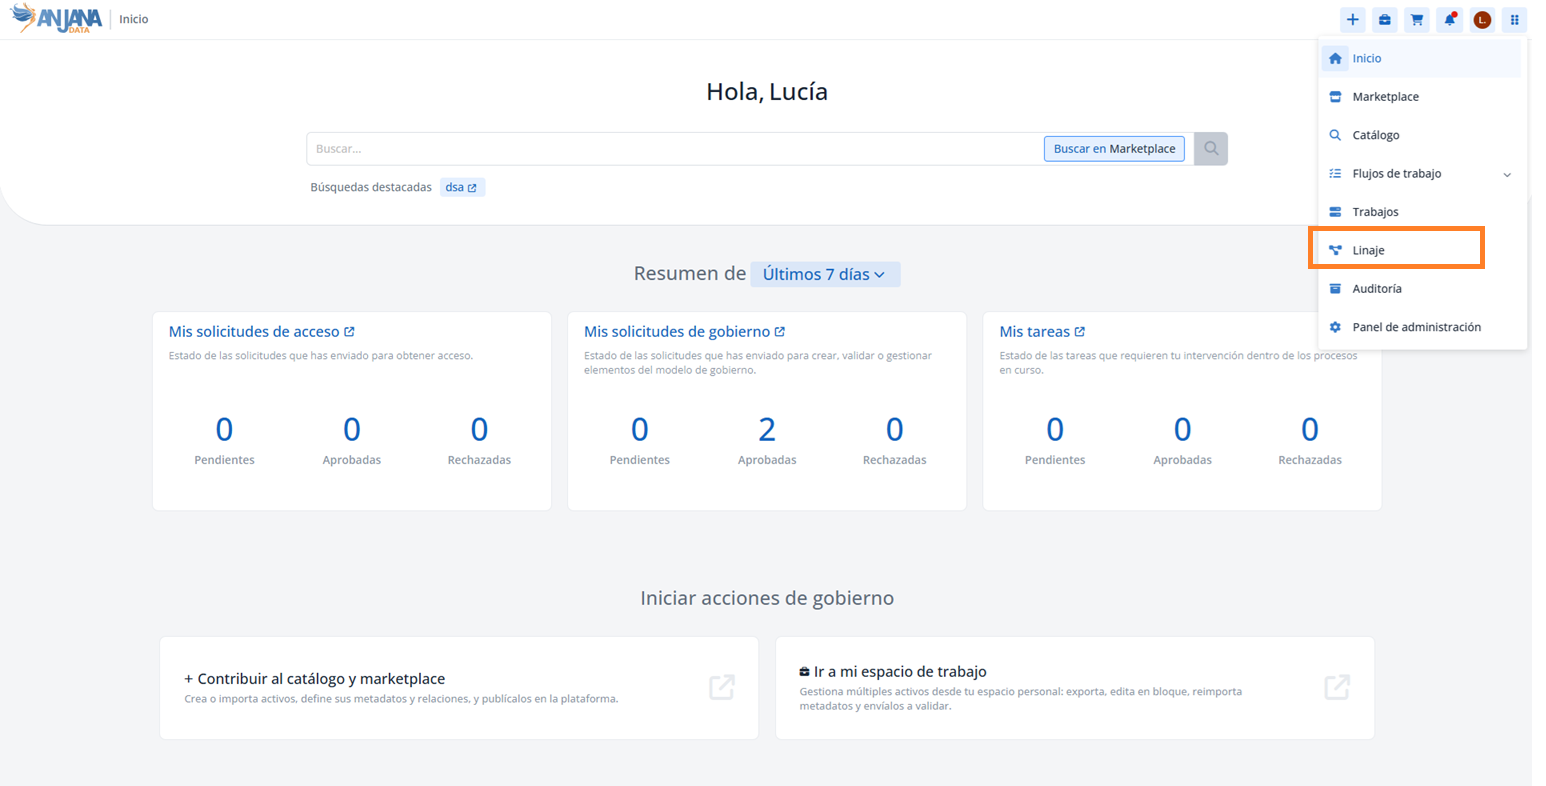
The pivot element
Exploration starts from a pivot element, from which relationships are expanded interactively. The pivot can be:
-
Entity: discover the related assets, the organizational unit it belongs to, its owners, and the users with access to its data (adherence), if it is a governed structure.
-
Relationship: discover the assets related to each other and their other relationships.
-
User: discover the assets they have access to (adherence) or own.
-
Organizational unit: discover the objects and owners in its domain.
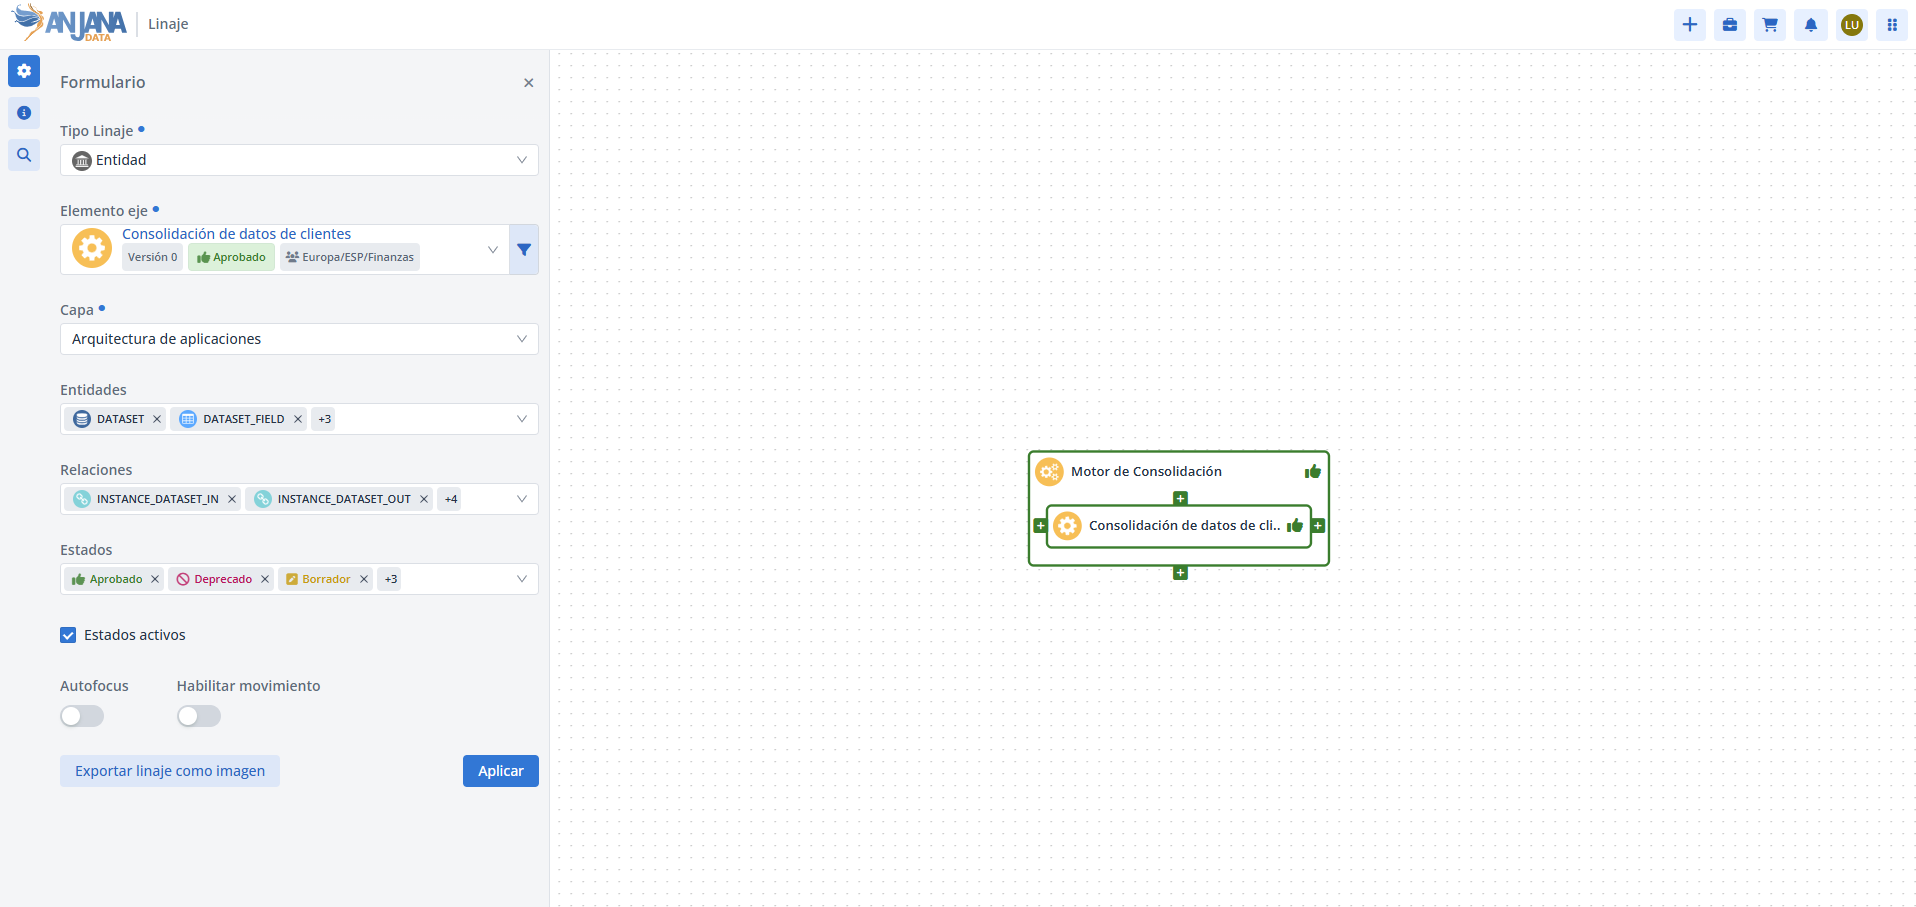
The graph
Nodes
In the lineage graph, a node is each of the elements represented as a "box": an entity, a user, or an organizational unit. Relationships are not nodes, but the connectors that link nodes to each other (see the Relationships section).
For each node, the subtype icon, the name, and, for entities, the status icon are shown, with the node border in the same color. Each node has buttons (up, down, left, and right) to expand or collapse its relationships.

Relationships
-
Parent-child (upward/downward) or aggregation: an aggregation relationship is represented by a node that contains its child nodes (for example, a DSA that contains a dataset, which in turn contains its
dataset_fields). -
Input and/or output (leftward/rightward): they represent the flow, for example a dataset that is the output of one process instance and the input of another.
Relationships shown as aggregation (a parent node that contains its child nodes) are not a distinct relationship type: they are parent-child relationships that have been configured, in a specific layer, to be represented that way. As a result, the same relationship can be shown as an aggregation in one layer and as a regular parent-child relationship in another. For more detail, see the page https://wiki.anjanadata.com/es/configuracion/26.1/relaciones-de-agregacion .
Exploration configuration
When accessing the screen, the user defines the pivot and adjusts the view from the lineage form.
Selecting the pivot element
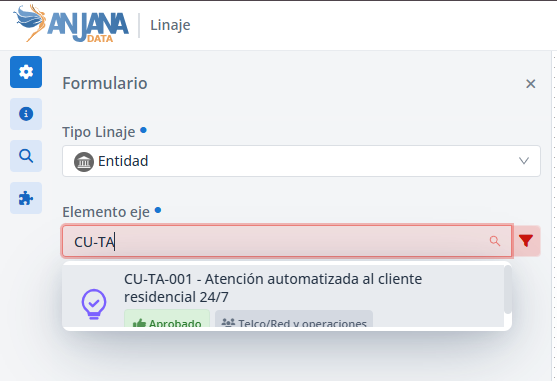
First, the type of object that will act as the pivot is chosen (entity, relationship, organizational unit, or user), followed by the specific element. The search tool offers autocomplete and allows the use of filters to locate entities and relationships.
Layers
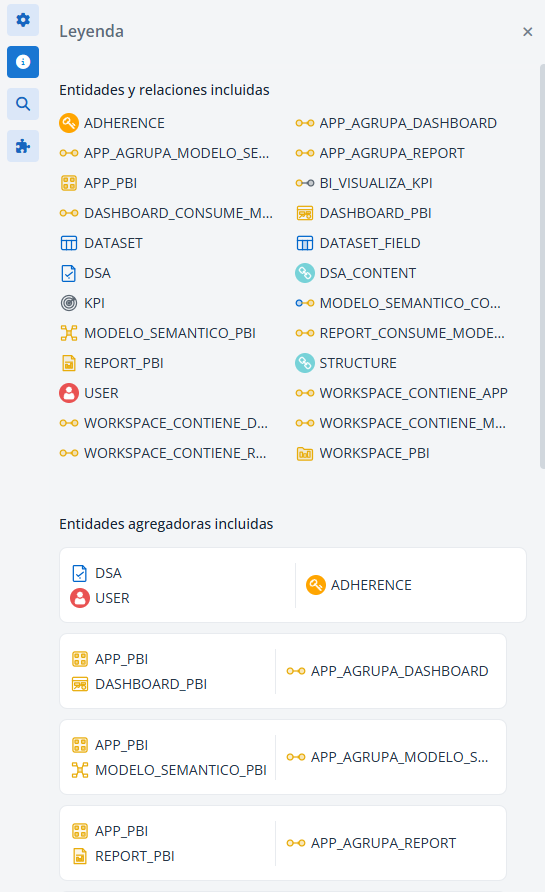
When the pivot is selected, the default layer is loaded automatically. Layers allow you to explore the lineage from different points of view: each layer defines which entities and relationships are included and which are represented as aggregation relationships. Anjana Data Platform provides the Base layer by default, which contains all entity and relationship types. The legend button shows the entities and relationships that correspond to the selected layer.
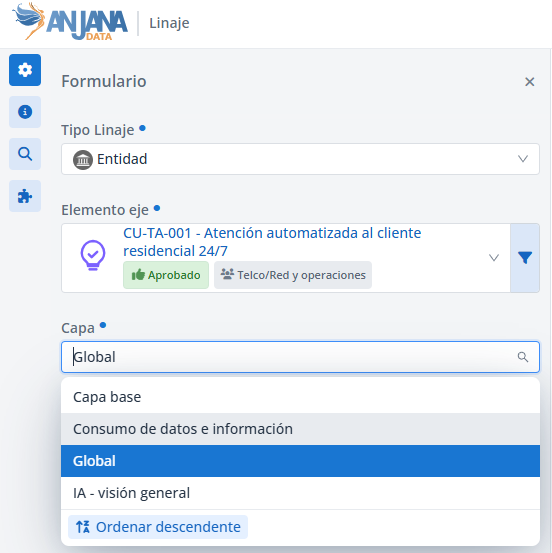
The legend button shows the entities and relationships that correspond to the selected layer.
Filters
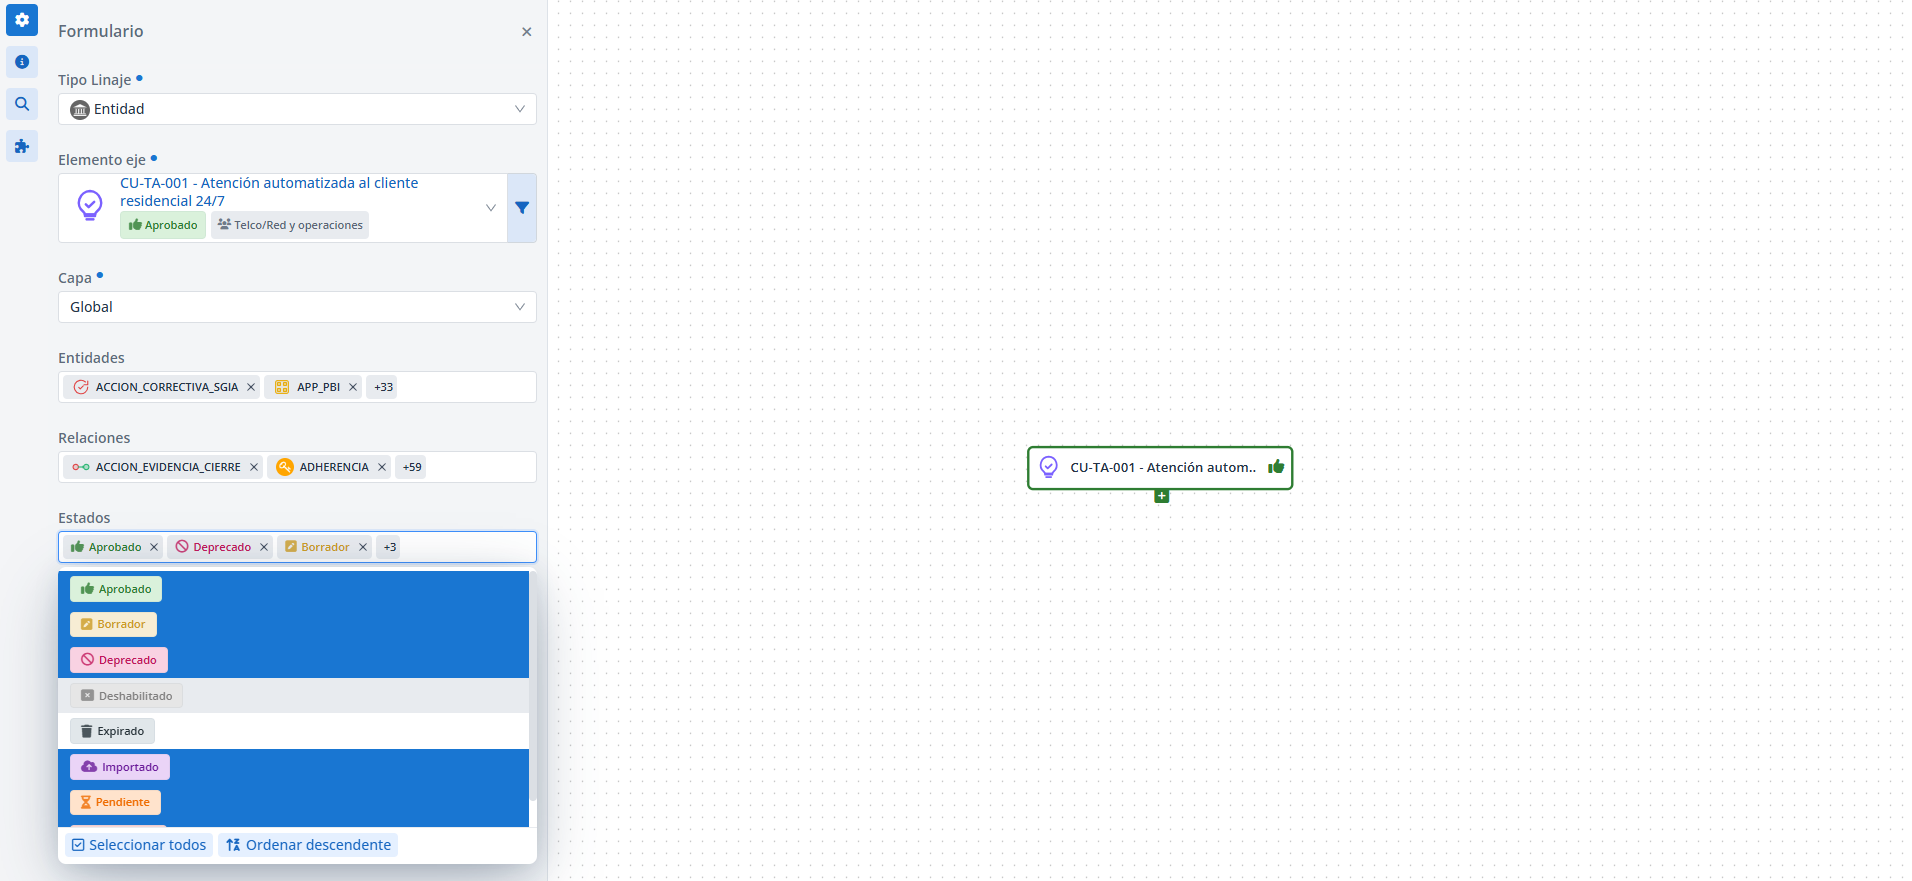
When a layer is selected, its filters are loaded, which narrow down what is shown in the graph by entity subtype, relationship subtype, and object status.
Active status filter
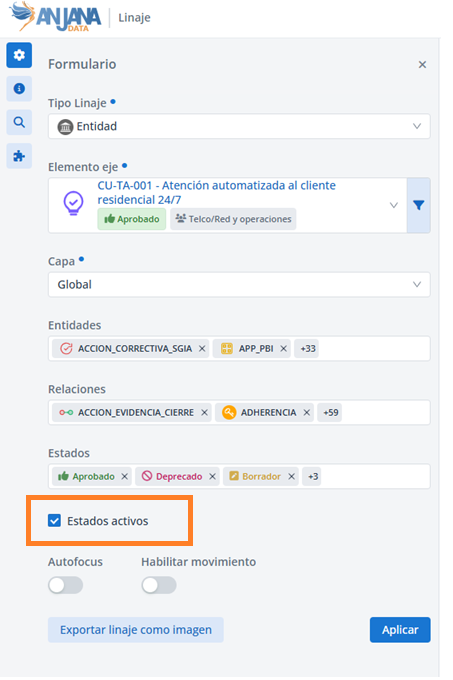
The form includes an active status checkbox that, when checked, hides entities and relationships with Disabled and Expired status, showing only active ones.
Other display options
-
Autofocus: automatically centers the nodes expanded in the graph during exploration.
-
Enable movement: allows you to rearrange nodes by placing them wherever you want. Once enabled, you can click a node and drag it across the canvas.
All changes in the panel (layer, entity/relationship/status filters, autofocus, and movement) are applied when you click Apply, except for changing the pivot element, which updates the graph automatically. Any change to the pivot, filters, or layer resets the graph, keeping only the pivot, so Anjana Data Platform asks for confirmation. The Export lineage as image button allows you to download the visible graph in .png format (useful for sharing, documenting, or saving a snapshot before making changes).
If some objects you expected to see do not appear in the lineage, the cause is usually one of two filters in the form:
-
The selected layer: each layer defines (and therefore filters) the subtypes of entities and relationships that are displayed. An object whose subtype is not included in the layer will not be shown.
-
The active status filter: if checked, it hides entities and relationships with Disabled and Expired status.
Before concluding that an object is not part of the lineage, it is advisable to check the selected layer and the state of the active status filter.
Search within the graph
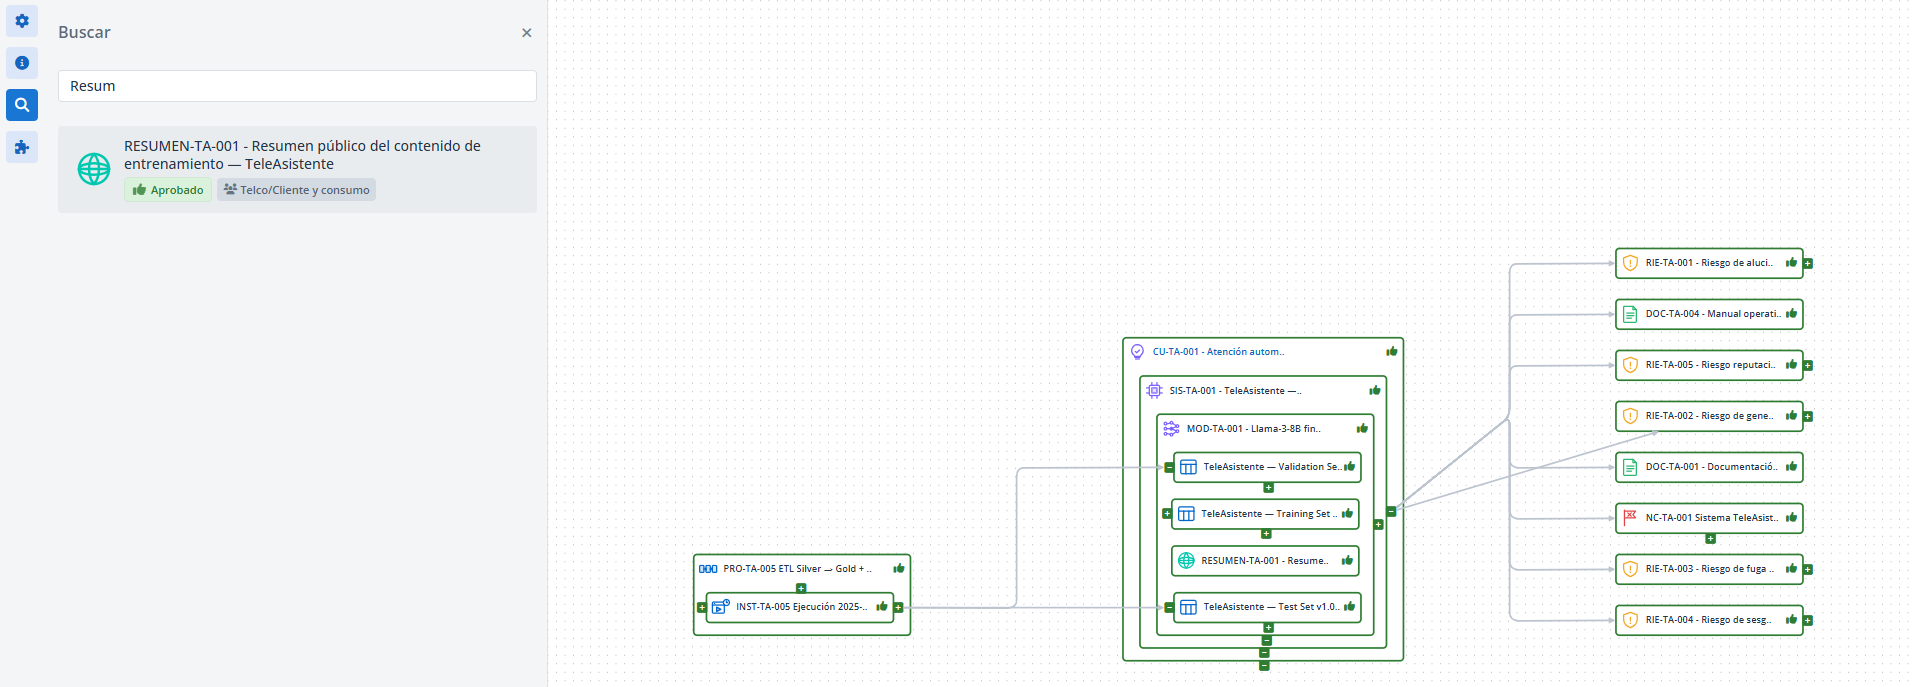
To locate a specific object within the already expanded lineage, the user can open the search tool and search within the graph. If several objects match the searched name, clicking one centers the graph on it and highlights it in blue.
Selected node panel
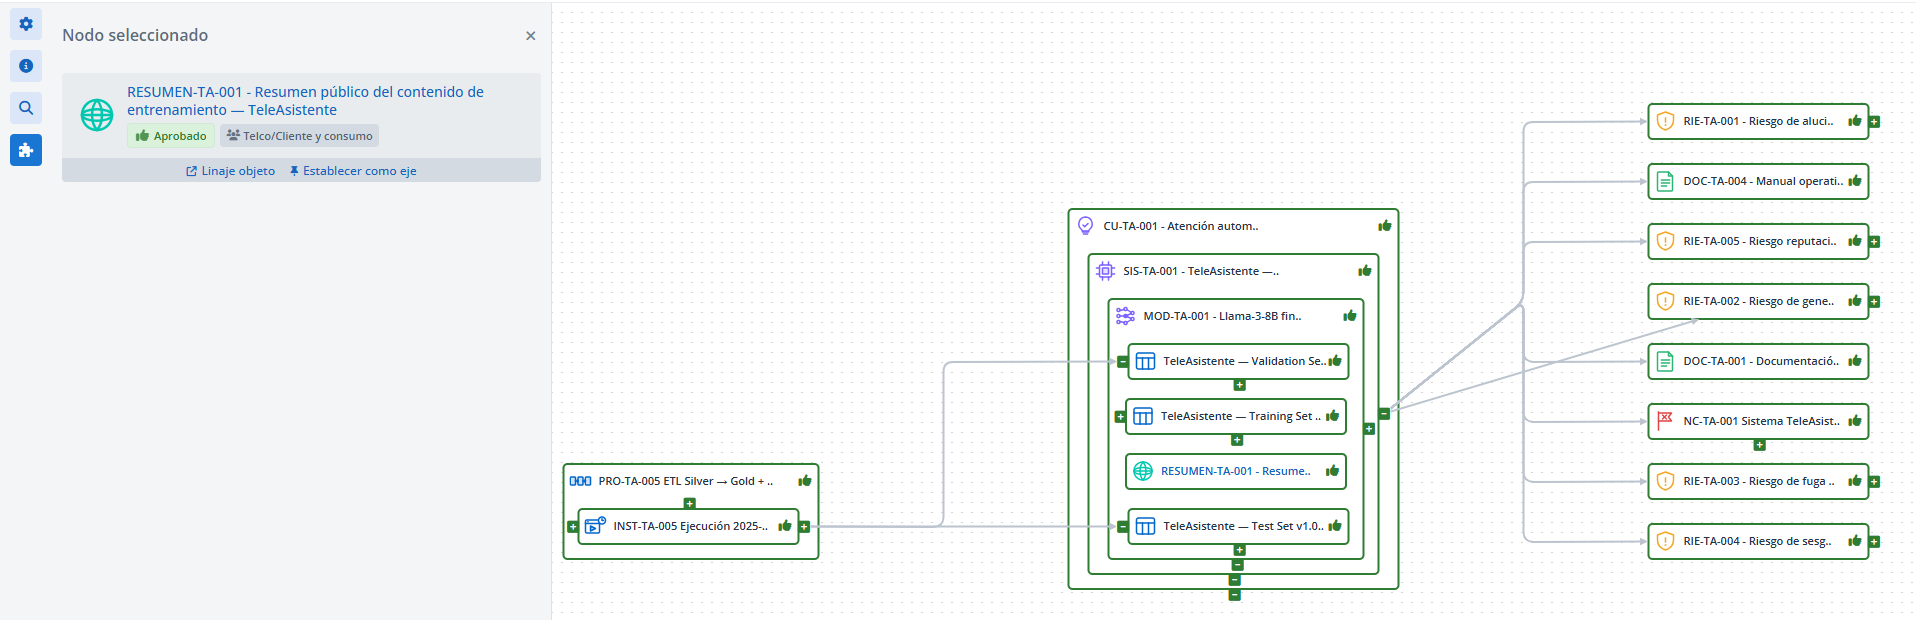
Clicking any object in the graph (entity or relationship) shows its related information in the Selected node panel, from which the information flow can be displayed step by step. From this panel it is also possible to change the pivot element to continue exploring from that object, or navigate to its specific lineage.
Special cases in the representation
Repeated nodes in the lineage
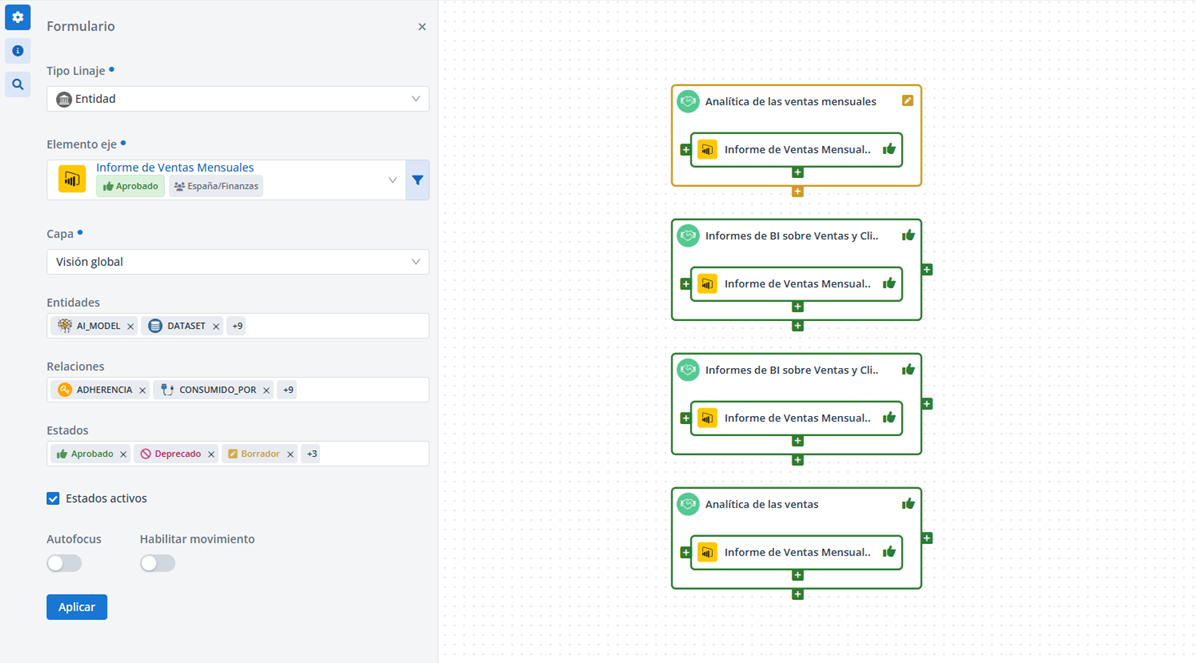
When the pivot element is the target of an aggregation relationship in the displayed layer, it is shown contained within its source entity; if it is part of a set of aggregations, the entire expanded family is shown. If the pivot has several parents with an aggregation relationship, it will appear repeated as many times as it has parents. When that same object is reached by expanding from another entity, its parents are not shown by default and must be expanded. Each repetition of a node can be expanded and collapsed independently.
Different nodes depending on the pivot element (same layer)
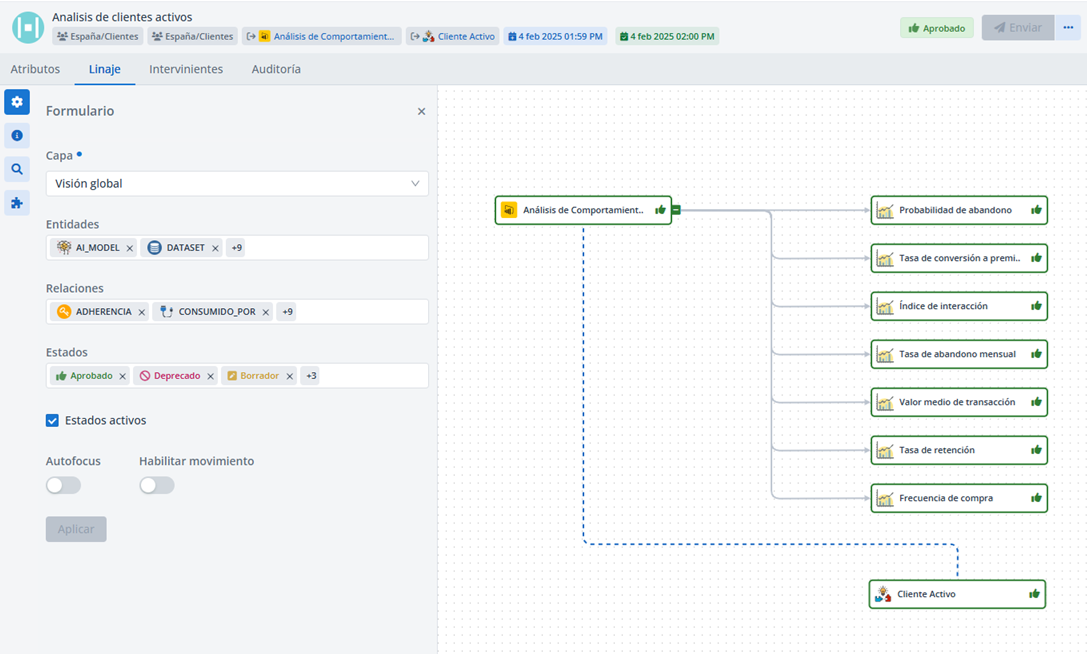
The graph can show different nodes depending on the chosen pivot: if the pivot is a relationship, its source and target entities are shown even if they do not pass the layer's entity filter; but if one of those entities is chosen as the pivot, the other may not pass the subtype filter and not appear. The same can happen with relationships or statuses that do not pass the corresponding filter (see the warning above).
This section is aimed mainly at Data Portal users who explore the asset lifecycle (for example, Data Stewards, Data Owners, and governance profiles).